
Tags
Cultural Marxism, Deconstructionism, Father Anthony Cekada, Fox News, Francis Effect, Frankfurt School, FSSP, Genderism, George Soros, Germany, Giardia lamblia, Gonorrhea, Great Cardinal, Havana, Hemorrhoids, heretical pope, Herpes simplex virus, hippies, HIV, Holy Year of Mercy, Human immunodeficiency virus, Human papilloma virus, Humanism, Isospora belli, Jacque Derrida, James O'Keefe, Jesuits, Jesus Christ, Joseph Ratzinger, Jozef Pilsudski, Keynes, Keynesian Economics, Kirill I, Krakow, Law of Unintended Consequences, messeging, Mexico City, Microsporidia, Miracle on the Vistula, Modernists, MSM, narratives, Nassim Taleb, neo-modernism, Neo-Pagan, Net Neutrality, new springtime, New York Times, Nigel Farage, Pagan Christians, pathological, Poland, Polish Bolshevik War 1920, Pontifical High Mass, Pope Pius VI, President Andrzej Duda, President Donald J. Trump, Project Veritas, Raymond Burke, Republic of Poland, retained foreign bodies, risk event, Roman Curia, s "c"atholicZombie, s "theological structuring", s ABC News, s ABERRO AGENDA, s aberro-sex agenda, s AIDS, s Ambiguity, s Anal Cancer, s anorectal traum, s Archbishop of Warsaw- Praga, s Associated Press, s Austria, s Benedict XVI, s Bergoglio, s Big Gender, s Card. Muller, s Cardinal Burke, s Cardinal Kazimierz Nycz, s cardinal Walter Kasper, s Chapel of the Holy Trinity, s chastity belts, s Chlamydia trachomatis, s Pope Francis, Saul Alinsky, sBoris Johnson, sCatholic Church, sCavalcade of the Three Kings, sCryptosporidium, Sexually transmitted diseases, spirit of Vatican II, SSPX, St Thomas Aquinas, sustainability, Synod 2014, Synod of Filth, Syphilis25, Tags anal fissures, Tags Black Lives Matter, Tags Catholic Church in Poland, TagsBREXIT, Team Bergoglio, The Remnant, The Scholasticum, theological deconstructionism, Thomism, Tradition, TransRational, Truth, Unjust ruler, US Presidential Election 2016, Vatican II, Work of Human Hands, Zombie, ZombieBishop, ZombieChurch
 Good morning dear readers. As you are waking up, the Presidential Election is upon us. Approximately 45 minutes ago, the citizens of Dixville Notch in the “battleground” state of New Hampshire have gone to the POLLS and cast their ballots for the future President of the United States of America.
In today’s post we pick up where we left off on this thread yesterday, namely HERE.
Deus Ex Machina (DEM) BASE LINE ASSUMPTIONS (BLA’s)
And just a quick recap and defining the BASE LINE ASSUMPTIONS. In the first part of this post, I identified several EFFECTS that have in turn been picked up my the Deus Ex Machina Peirce Ockham Pragmatic Methodology (see here). They are as follows:
Major EFFECTS
- Black Dissatisfied Voter EFFECT
- Pissed Off Millennial EFFECT
- Biting Ones Nose to Spite Ones Face EFFECT
- Open Borders EFFECT
Minor EFFECTS
- Spent CELEBRITARD EFFECT
- Long VOTER Lines EFFECT
- CALIFORNIA/NEW YORK/ BIG STATE EFFECT
- HIDDEN Trump-o-crats EFFECT
- SickHillary vs. Jimmy Carter EFFECT
- Idealistic “liberal”/Ashamed of Hillary EFFECT
- Playing defense EFFECT
- EXCESS CORRUPTION EFFECT
- Lady-Boy Barry 5th Column EFFECT
- REVERSE THUMPING HILLARY EFFECT
The reason that I bring this matter to your attention is that all these above listed EFFECTS will have a direct impact on how individual VOTERS will cast their BALLOT. Or at least, that is what the sources of these identified EFFECTS claim. And I agree with these claims, hence I identify and list them.
As for the Sick, Crooked, Unelectable Hillary EFFECTS, your humble blogger has only been able to identify ONE. And that one is the MASS HYSTERIA INDUCED LATINO MARGINAL VOTE. This effect can best be described as an increase in VOTER TURNOUT by ethnic Hispanic VOTERS on account of the Spanish News Organizations whipping up mass hysteria. From what I have been able to observe, and it has been confirmed by sources like the Mexican (owned) New York Times, this EFFECT is negligible and only present in a few swing states, namely California.
So what I will do today is start with the FRAUDULENT POLL-STER’S POLLING averages, and adjust them for NORMALITY, or as we like to say on this blog, OBJECTIVE REALITY.
What is also of note is that all these EFFECTS can be quantified and “induced” into any statistical or “POLLING” model. But since I am not a POLL-STER, it is beyond my competence level. However, I can give a rough calculation of the impact that it could have on a STATE by STATE basis. And that is how we will precede today.
Now to the POLLS.
So today, we will start out with the POLL-STER’S CORRUPTED BLA’s. Most optimal place to start is HERE. Below is the RealClearPolitics website’s latest ELECTORAL VOTING totals based on their POLLING AVERAGES:

In the write up of the analysis, what can be observed is that Florida, North Carolina, and Ohio are firmly in the Trump camp. Here is the RealClearPolitics ELECTORAL MAP:

As we can see above, the battleground STATES now are: CO, NH, MI, NV, MN, ME.
Now please observe, any switch from the SickHillary camp to the Trump camp in any one of these states leaves SickHillary below the 270 ELECTORAL VOTE LEVEL. Furthermore, all of these STATES are considered “toss ups”. NB: Please also keep in mind that in early VOTING in CO, Trump is winning, which is a SHOCK in and of itself. But I digress…
Now let’s look at this above situation in terms of math. Since these above 5 STATES (CO, NH, MI, NV, MN, ME) are “toss-up”, that implies that they can go either way, i.e. a 50% probability that they will stay in the SickHillary camp.
Now dear reader, what do you think the probability is that Sick Hillary will keep all 5 states in the SickHillary camp? In mathematical terms, it is this:
50% x 50% x 50% x 50% x 50% = .50^5 = 0.03125 = 3.125%
And naturally, the probability that Trump will lose all 5 STATES is 3.125%
And to finish this thread, please keep in mind that for at least the last week, all the action has been in Blue, leaning Blue or toss-up STATES. This is what we have termed the Playing defense EFFECT. What this further mean is that none of the STATES in the Trump camp are in play. So Hillary, if she looses one of the above battleground states, can’t count on picking up anything from Trump.
This is the OBJECTIVE REALITY of the situation folks.
So what we see in the equation above, given the CORRUPTED POLL averages provided by RealClearPolitics is that it is highly unlikely that Trump will lose this one.
Which begs the question, by how much will Trump win?
The Swing-State Breakdown
Before we get into the BREAKDOWN, there are three STATES that are SOLID TRUMP, yet they appear in the SickHillary Camp just due to the Ind/Rep/Dem breakdown in the general population. These STATES are Kentucky, North Carolina, and West Virginia. I think it is a reasonable assumption to include these in the Trump Camp.
Next, going over to the yesterday’s post, we have an idea about how much “oversampling” is embedded in the RealClearPolitics POLL average. If the SWING STATE averages were brought in line with just the conventional Independant, Repubican, Demographic breakdown that exists in the general population, we would have the respective totals:

So after adjusting the RealClearPolitics Electoral Map by just bringing in line the Ind/Rep/Dem breakdown to reflect that which is in the general population, the following is the case:

So let’s call this the BASE CASE SCENARIO ADJUSTED FOR NORMALITY.
The Blue States Breakdown
So that leaves the rest of the Blue States that are supposedly in the Clinton Camp. Yet among those STATES that are in the Clinton camp above, when adjusting for NORMALITY, we find STATES that switch into the Trump Camp. Here are those STATES:

So let’s modify our ELECTORAL COLLEGE map for these “adjustments for NORMALITY”. Here is how that looks:

So what we see above is the ELECTORAL COLLEGE map brought in line with POLLS that reflect the breakdown among Ind/Rep/Dem that exists in the general population.
Impact of the EFFECTS:
I will break down the EFFECTS into Major and Minor.
Let’s start with the Major EFFECT that is the Black Dissatisfied Voter EFFECT. This EFFECT is well documented and according to our sources (Breitbart), it is roughly +2% to Trump/-2% to SickHillary. If we adjust our Hillary Camp States for this EFFECT, we get the following table:
So here is how that ELECTORAL map would look after adjusting for Black Dissatisfied Voter EFFECT:

Notice, California comes into the Trump column after NORMALIZATION of RealClearPolitics POLL averages and adjustment for the Black Dissatisfied Voter EFFECT. What could be the case here is that the only EFFECT that is positive for SickHillary, i.e. the MASS HYSTERIA INDUCED LATINO MARGINAL VOTE can be NEUTRALIZING the Black Dissatisfied Voter EFFECT. I think this is a reasonable (SUBJECTIVE) adjustment to make, especially since California has a large Hispanic community and a relatively less large Black community.
So putting California back into the SickHillary Camp, this is what we have:

With respect to the other Major and Minor EFFECTS, I do not have any solid indicative values from my source material. So here is what we will do. We will look at them on a case by case basis and assess if any of there could be a Major or Minor EFFECT at play.
Here is the table of the remaining STATES that are still in the SickHillary camp:

What is of interest is that the great STATE of New Mexico is still in the SickHillary camp, yet we know that it is considered a “toss-up” STATE. What is also of interest is that if any of the other Major or Minor EFFECTS are at work in NM, a pick-up of only 0.2% will create a tie, and a pick-up of 0.2000001% will give the STATE to Trump. And since it is the CORRUPT POLL-STER’S who are claiming that NM is in the “toss-up” group, it is reasonable to expect to see the Major and/or Minor EFFECTS take it across the line.
Next, a similar case can be made for the great STATE of Vermont. A 0.45% change will create a tie, and a pick-up of 0.4500001% will give the STATE to Trump. Therefore, it is reasonable to expect to see the Major and/or Minor EFFECTS take it across the line.
And finally, the great STATE of Hawaii appears also to be in play. But I think HI is similar to CA in that it has a specificity to its electorate. This specificity would not suggest that it will go over into the Trump camp.
So let’s make the above adjustments to the ELECTORAL map:

So this is how the… let’s call it the SOLID DEM ELECTORAL COLLEGE MAP looks.
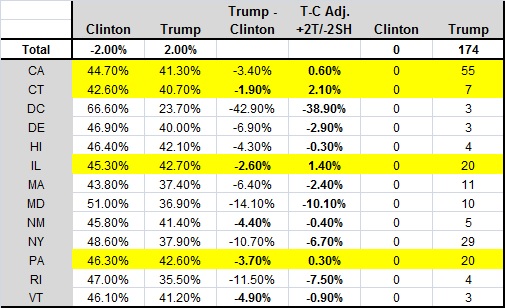
Which leaves us with the following STATES still in the SickHillary Camp:

Which leaves what can be called the SOLID Blue STATES of DC, DE, MA, MD, NY, RI and the two special cases CA and HI still in the SickHillary camp. I think it is this group of STATES that are the most likely to still be in the SickHillary camp after today’s VOTING.
Summa Summarum
When looking at the above list, I have not identified any one particular EFFECT that could be a game changer with respect to these STATES.
Yet, a combination of the Pissed Off Millennial EFFECT (Major EFFECT) and some of the Minor EFFECTS, namely HIDDEN Trump-o-crats EFFECT, Long VOTER Lines EFFECT, SickHillary vs. Jimmy Carter EFFECT, Idealistic “liberal”/Ashamed of Hillary EFFECT, EXCESS CORRUPTION EFFECT and REVERSE THUMPING HILLARY EFFECT could be particularly strong in the North East and East Coast where the last bastion of SickHillary “Left-ism” is the strongest.
If I were a betting man, and the odds were right, I could be enticed to wager that a New York (-10.70%) could get a swing of 5.36% with a TRUMP TSUNAMI in Upstate New York for example, and get it into the Trump camp. If that happens, then obviously Trump would also pick up DE, MA and RI in the process.
But for today, I will stick with the last ELECTORAL MAP as the official Deus Ex Machina ELECTORAL COLLEGE MAP.
And seeing as how the VOTING has already started, we will know in a matter of hours, just how close your humble blogger has identified OBJECTIVE REALITY, as opposed to how the MainStreamMedia AGITPROP PRESSTITUTES and professinal POLL-STER’S have tried to present it to the ELECTORATE.
I have placed the official DEM ELECTORAL MAP at the top of this post.
And now, the waiting (and VOTING) begins…

Been on a daily follower since I discovered your site a few months back. Much appreciate your Aristotelian/Aquinas governing principles.
From California (Jamestown). You are correct (spot on, and all that) regarding California’s *specificity*.
LikeLike
It’s all those East Coast hippies who couldn’t afford a bus ticket back to upstate New York in late 1960’s.
LikeLike
Other points of view:
http://heavy.com/news/2016/11/presidential-election-results-winner-odds-predictions-polls-who-will-trump-or-clinton-win-november-8-percentages/
LikeLike
Yea, they are all over the place.
I am watching FoxBus today. I don’t watch TV as a rule. I am amazed how Maria Bartiromo is focusing on crowds and enthusiasm.
The best line was from Laura Ingram who said that “Hillary could set on fire a homeless person and the Democrats would explain it away”.
So we will see…
LikeLiked by 1 person
Yes. I believe she could announce that once President she would exterminate allTrump supporters and this would also be quite acceptable, even uplifting, to her supporters. Clearly, most Democrats appear to be morally challenged.
LikeLike
It’s a mental process. The continuous history of FAILURE has to have a penetrator. And the utopia always waits after the next execution…
LikeLike